Deploy Graphite with Grafana on Ubuntu 14.04
Traducciones al EspañolEstamos traduciendo nuestros guías y tutoriales al Español. Es posible que usted esté viendo una traducción generada automáticamente. Estamos trabajando con traductores profesionales para verificar las traducciones de nuestro sitio web. Este proyecto es un trabajo en curso.
DeprecatedThis guide has been deprecated and is no longer being maintained. Please refer to the updated version of this guide.

Set Up Graphite Monitoring Software with Grafana on Ubuntu
Graphite is an enterprise-level monitoring tool renowned for performing well on systems with limited resources. It stores numeric time-series data and renders graphs of this data on demand. This guide provides an introduction to the installation and basic setup of Graphite together with Grafana, a popular open source application for visualizing large-scale measurement data, on Ubuntu 14.04.
Before You Begin
Familiarize yourself with our Getting Started guide and complete the steps for setting your Linode’s hostname and timezone.
This guide will use
sudowherever possible from an example account namedgraphite. Complete the sections of our Securing Your Server guide to create thegraphiteuser, harden SSH access, remove unnecessary network services and set up a firewall. You may need to create additional firewall rules for your specific application.Update your system:
sudo apt-get update && sudo apt-get upgrade
Install Apache, Python Tools and Graphite
Install the system packages required for working with Graphite:
sudo apt-get install build-essential graphite-web graphite-carbon python-dev apache2 libapache2-mod-wsgi libpq-dev python-psycopg2During the installation of
graphite-carbon, you will be asked if you want to remove the whisper database files should you ever uninstall Graphite. Answer No to this prompt. You can always remove the files later (which are located in/var/lib/graphite/whisper).
Configure Carbon
Configure the retention rate for test metrics by adding a
[test]block to Carbon’sstorage-schemas.conffile. This step is given for testing purposes only and can be safely skipped if you have no use to generate test metrics.The retention times given below will save data every 5 seconds for 3 hours, and a separate set of data from that aggregated sample every 1 minute for 1 day.
- File: /etc/carbon/storage-schemas.conf
1 2 3 4 5 6 7 8 9 10 11[carbon] pattern = ^carbon\. retentions = 60:90d [test] pattern = ^test\. retentions = 5s:3h,1m:1d [default_1min_for_1day] pattern = .* retentions = 60s:1d
For more information on how to configure Carbon storage, see the section storage-schemas.conf in Graphite’s documentation.
Copy the default aggregation configuration to
/etc/carbonso we can configure our own settings:sudo cp /usr/share/doc/graphite-carbon/examples/storage-aggregation.conf.example /etc/carbon/storage-aggregation.confstorage-aggregation.confdescribes aggregation policies Carbon uses to produce less detailed metrics, such as the 1m:1d retention in the [test] block added above. By default, only the average metric value is taken, which will result in data loss when, for example, you need maximum and minimum values. For this reason,[min],[max]and[sum]sections are found in the configuration file.Enable Carbon’s cache to run on boot:
- File: /etc/default/graphite-carbon
1CARBON_CACHE_ENABLED=true
Start the Carbon cache service:
sudo service carbon-cache start
Install and Configure PostgreSQL
Install PostgreSQL for the graphite-web application:
sudo apt-get install postgresqlChange to the
postgresuser and create a database user for Graphite:su - postgres createuser graphite --pwpromptYou will be asked to provide a password for the new database user. After that, create the databases
graphiteandgrafanawith the system’sgraphiteuser as the owner:createdb -O graphite graphite createdb -O graphite grafanaWhen finished configuring the PostgreSQL databases, change back to the
graphiteuser:su - graphite
Configure Graphite
Update Graphite’s
DATABASESdictionary definition with the settings for the PostgreSQL database created earlier:- File: /etc/graphite/local_settings.py
 1
 2
 3
 4
 5
 6
 7
 8
 9
10
DATABASES = { 'default': { 'NAME': 'graphite', 'ENGINE': 'django.db.backends.postgresql_psycopg2', 'USER': 'graphite', 'PASSWORD': 'graphiteuserpassword', 'HOST': '127.0.0.1', 'PORT': '' } }
Also add the following lines to the end of the file:
- File: /etc/graphite/local_settings.py
1
2
3
USE_REMOTE_USER_AUTHENTICATION = True TIME_ZONE = 'Your/Timezone' SECRET_KEY = 'somelonganduniquesecretstring'
TIME_ZONE is your Linode’s time zone, which will be used in graphs. For possible values, run
timedatectlor see the TZ column in Wikipedia’s timezone database.SECRET_KEY is a long and unique string used as a salt when hashing passwords.
Initialize the database with:
sudo graphite-manage syncdbThen answer the prompts to create a superuser account which will be used to access Graphite’s web interface.
Configure Apache for Graphite
Copy Graphite’s Apache config template into Apache’s
sites-availabledirectory:sudo cp /usr/share/graphite-web/apache2-graphite.conf /etc/apache2/sites-availableChange Graphite’s port from 80 to 8080 (port 80 will be used for Grafana later).
- File: /etc/apache2/sites-available/apache2-graphite.conf
1<VirtualHost *:8080>
Make sure Apache is listening on port 8080. Add
Listen 8080afterListen 80inports.conf:- File: /etc/apache2/ports.conf
1
2
Listen 80 Listen 8080
Disable the default Apache site to avoid conflicts:
sudo a2dissite 000-defaultEnable Graphite’s virtual site:
sudo a2ensite apache2-graphiteReload Apache to apply the changes:
sudo service apache2 reloadNow you should be able to access Graphite by going to your Linode’s hostname or IP address using port 8080 in a web browser (ex:
example_domain.com:8080). You’ll see the Graphite landing page as shown below: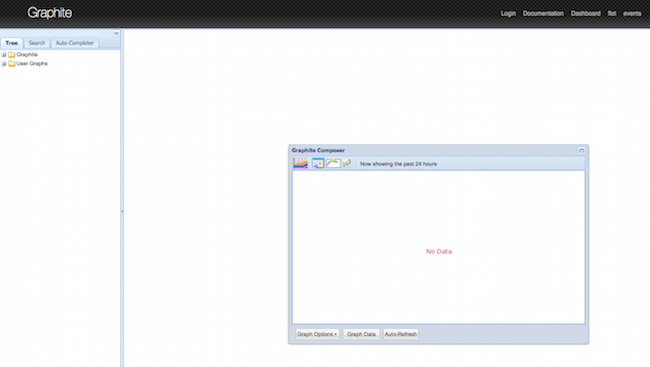
Create Sample Data
Generate some test metrics with the following command:
for i in 4 6 8 16 2; do echo "test.count $i `date +%s`" | nc -q0 127.0.0.1 2003; sleep 6; doneWait for the command prompt to be returned. Refresh the page and you should see a new
test.countmetric in the tree on the left: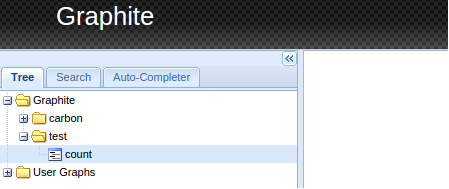
Install and Configure Grafana
Add Grafana’s repository to
sources.list:echo 'deb https://packagecloud.io/grafana/stable/debian/ wheezy main' | sudo tee -a /etc/apt/sources.listAdd the Package Cloud key to install signed packages:
curl https://packagecloud.io/gpg.key | sudo apt-key add -Update apt and install Grafana:
sudo apt-get update && sudo apt-get install grafanaConfigure Grafana to use the PostgreSQL database created earlier:
- File: /etc/grafana/grafana.ini
1
2
3
4
5
6
7
[database] # Either "mysql", "postgres" or "sqlite3", it's your choice type = postgres host = 127.0.0.1:5432 name = grafana user = graphite password = graphiteuserpassword
Also in
/etc/grafana/grafana.ini, configure thedomainandroot_url, and set a strong admin password and secret key:- File: /etc/grafana/grafana.ini
 1
 2
 3
 4
 5
 6
 7
 8
 9
10
11
12
[server] protocol = http http_addr = 127.0.0.1 http_port = 3000 domain = example.com enforce_domain = true root_url = %(protocol)s://%(domain)s/ [security] admin_user = admin admin_password = SecureAdminPass secret_key = somelongrandomstringkey
Enable proxy modules for Apache reverse proxying to work:
sudo a2enmod proxy proxy_http xml2encCreate an Apache site configuration file to proxy requests to Grafana. Remember to change
example.comto your own domain:- File: /etc/apache2/sites-available/apache2-grafana.conf
1
2
3
4
5
6
<VirtualHost *:80> ProxyPreserveHost On ProxyPass / http://127.0.0.1:3000/ ProxyPassReverse / http://127.0.0.1:3000/ ServerName example.com </VirtualHost>
Enable Grafana’s site configuration with:
sudo a2ensite apache2-grafanaConfigure Grafana to run after boot and then start service:
sudo update-rc.d grafana-server defaults 95 10
sudo service grafana-server start
Restart Apache to load the new modules and configuration changes:
sudo service apache2 restartAt this point, you should be able to open your Linode’s domain or IP address in a browser to see Grafana’s login page.
Add a Graphite Data Source to Grafana
Log in into Grafana using the
admincredentials you specified ingrafana.iniabove.Click on Data Sources and select Add new. Fill in all the fields as shown in the screenshot below:
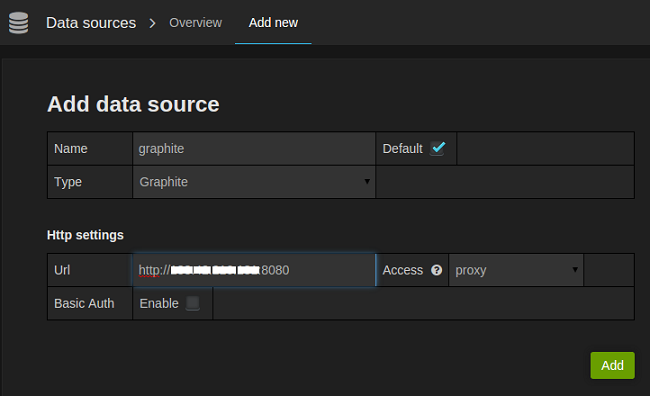
Click Save to create the new Data Source.
Now, before creating a graph, add more test data for the
test.countmetric by again running:for i in 4 6 8 16 2; do echo "test.count $i `date +%s`" | nc -q0 127.0.0.1 2003; sleep 6; doneCreate a new dashboard by clicking the Home button and then + New:
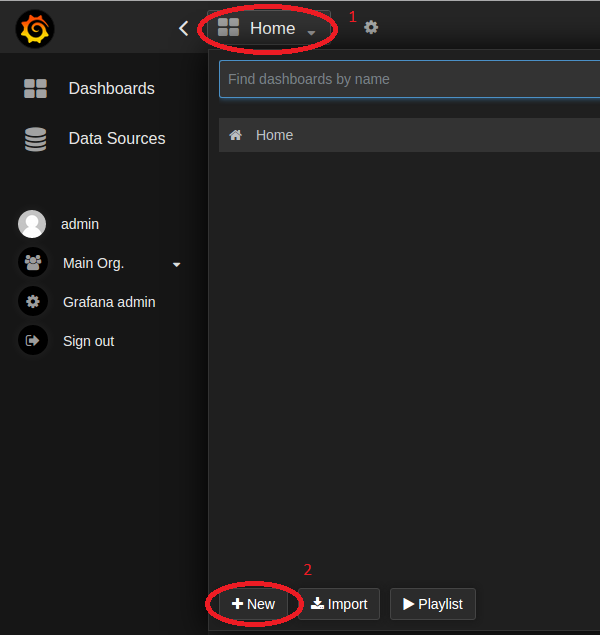
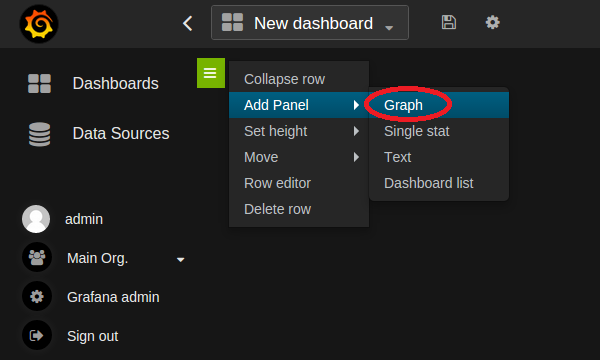
Add a Graph panel to the newly created dashboard:
Edit the Graph panel properties by clicking the tab with the words no title (click here). Then click Edit:

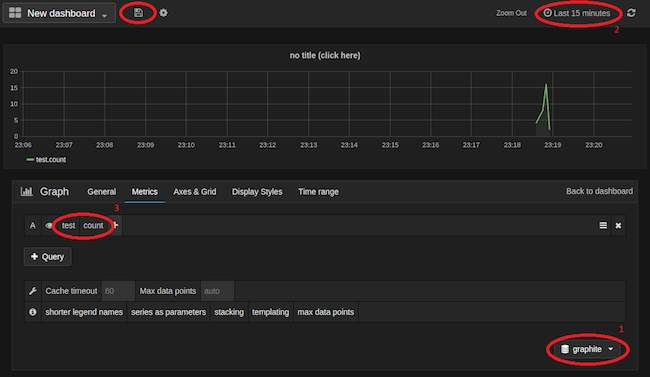
Make sure the graphite data source you’ve created is chosen in the dropdown box at the bottom right (marked as 1 in the screenshot below). In the dropdown at the top right corner (marked as 2), choose Last 15 minutes.
Click select metric. Choose test and then count (marked as 3) to add the test metric you previously created. At this point, the sample data should appear on the graph.
Finally, click the Save button (marked as 4) to save the dashboard you just created.
More Information
You may wish to consult the following resources for additional information on this topic. While these are provided in the hope that they will be useful, please note that we cannot vouch for the accuracy or timeliness of externally hosted materials.
This page was originally published on

